When is it Safe to Ignore SharePoint Health Analyzer Warning About Low Disk Space?
SharePoint Health Analyzer is a great tool for SharePoint Administrators that are responsible for managing a SharePoint on-premises installation. Not only this feature is helpful in troubleshooting issues with failing servers and failing services, it also gives you tips on how to fix the problems. Overall, I find this feature extremely helpful. However, there are some situations when the errors and warnings in the Health Analyzer can be completely bogus and must be ignored. One example of a bogus warning is a low-disk warning that I see on a lot of SharePoint servers during my consulting engagements. These are especially very common on SharePoint servers running in virtual environments, which I will explain in a minute. What’s interesting about this warning is that even if your hard drive was using only 1% disk space, the Health Analyzer may still warn you that you are at risk of running out of free space. Therefore, it’s quite common to see the following warning even on brand new installations of SharePoint servers.
Health Analyzer Warning Message
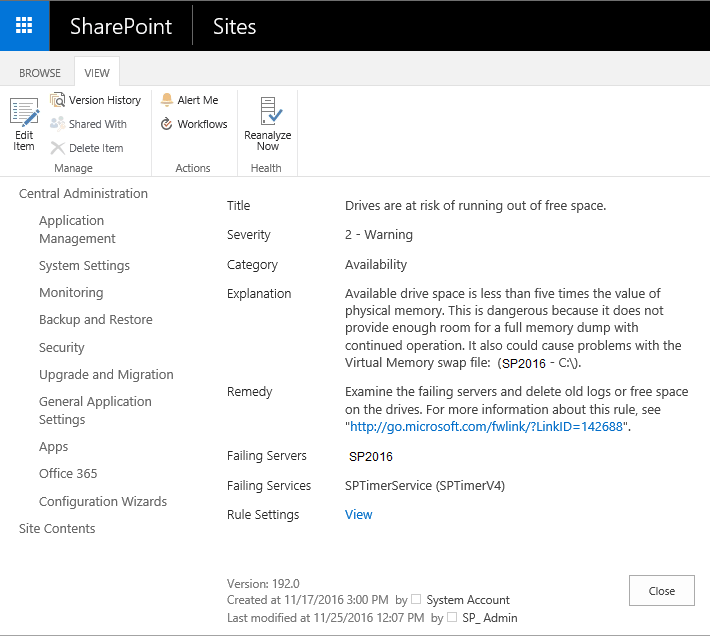
The warning message that you see in the Health Analyzer is:
Drives are at risk of running out of free space.
The failing service is SPTimerService (SPTimerV4) and is listed under the Availability category.
How Does Health Analyzer Calculate Low Disk Space?
To understand the low-disk warning, we need to look at how the Health Analyzer calculates the low disk space. According to the explanation in the above warning message, SharePoint calculates the low disk space based on the physical memory. The explanation for the warning states that the “Available drive space is less than five times the value of physical memory. This is dangerous because it does not provide enough room for a full memory dump with continued operation. It also could cause problems with the Virtual Memory swap file.”
NOTE: A pagefile (a.k.a. as swapfile) on a Windows computer is used by the operating system as if it were RAM. Every windows computer uses a pagefile, regardless of the amount of RAM installed on the system. The pagefile.sys is a hidden file, which resides by default in the root of drive C.
I would say probably 99% of my clients run SharePoint in a virtual environment, and so do I. A typical drive size of a Windows Server hosting a SharePoint Server installation is about 100 GB and a standard installation with all the Windows updates utilizes approximately 25-30GB, depending on the amount of RAM (which effects the size of the pagefile) and the applications that are installed. Therefore, if your available disk space is 75GB on a 100GB drive and you have assigned 16GB of RAM to your SharePoint server, you will still get the above warning and here’s why:
16GB of RAM x 5 = 80GB. When the disk space falls below 80GB (e.g. 79GB), you will see the low-disk space warning.
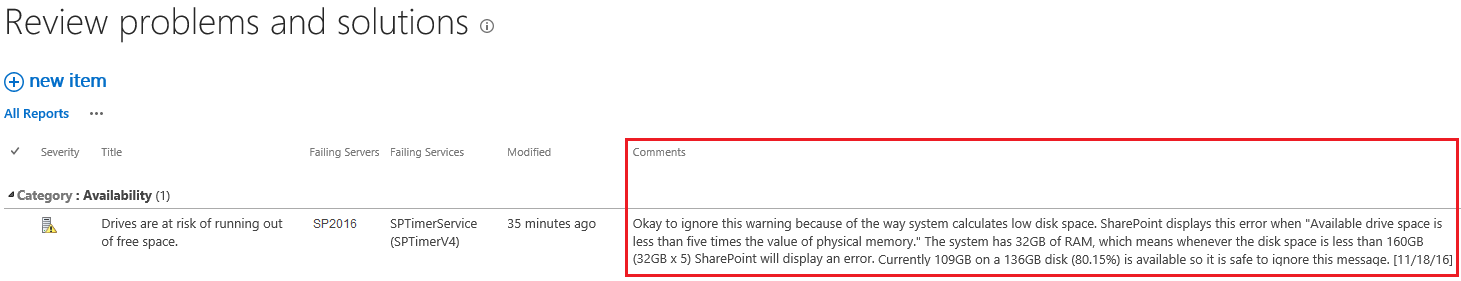
Let’s take another example. Let’s say you have a 150GB drive installed on a SharePoint Server that has 32GB of RAM. The Health Analyzer will give you a warning whenever your drive space falls below 160GB (32 x 5 = 160GB). What this means is that you are guaranteed to have the warning displayed, no matter how much disk space do you have. I am sure you would agree that if your drive capacity is 150GB, there’s no way you can ever have more than 160GB free disk space on your drive. Do you see why this message can be such a bogus warning?
I add a Comments column in Health Analyzer and put information to remind me why it is safe to ignore some of the warnings and errors. Here’s an example of what I do.
Let me address the second part of the explanation of this message which states “This is dangerous because it does not provide enough room for a full memory dump with continued operation.” A memory dump is when your system crashes and the information in the RAM is dumped into the dump file on your drive C. If you know what to do with it, you can try and figure out why your server crashed. If an application caused the crash, you can send the memory dump to the vendor so their developers can look into the dump file and read the debugging information to figure out what caused the crash. In the past 20 years, I have rarely seen a business actually utilizing the memory dump feature in a Windows server. By utilizing I mean using the debugging information internally or sending it to a vendor. Back in the Windows NT days we had a Microsoft Official Curriculum (MOC) course in which I taught the students how to use the memory dump. The class included a 3-4 hour lab in which the students were taught how to send the memory dump to the vendor, e.g. Microsoft, over a modem. In my experience, less than 1% of the Network Administrators know how to read or take advantage of the memory dump because the debugging information is primarily meant for the developers. Perhaps memory dump will be a good topic for another article but the point I am making here is this. If you have a large amount of RAM, you will need a large amount of disk space for the full memory dump. But ask yourself, do you know what to do with the memory dump? If the answer is no then the memory dump is nothing but a piece of junk sitting on your hard drive and you should delete it to free a lot of disk space.
The third part of the explanation states that “…It also could cause problems with the Virtual Memory swap file.” That’s absolutely true. If you have low disk space on a computer, especially on a server, you can be in trouble. Frankly, that’s the part that is more “dangerous”, not the fact that you don’t have enough free space for a full memory dump. Low disk space will cause problems with the hidden pagefile.sys file, which resides in the root of your drive C. However, if the warning message is bogus then it won’t have any impact on the pagefile.
The idea of memory dump was introduced in the days when the Blue Screen of Death (BSOD) was quite a normal occurrence. Windows crashes were common and everyone who used Windows was familiar with the dreaded blue screen, which was equated to the death of the computer. The debugging information was written to the memory.dmp file, which hardly anyone knew what to do with it. It was meant for Microsoft or other vendors to debug the cause of the crash. Those days are gone. For the past decade or so the BSOD has been a rare occurrence and perhaps the younger generation doesn’t even know what I am talking about. So let me ask you this question. How many BSODs have you experienced on my servers in the past year? Exactly my point!
By the way, Microsoft introduced a Red Screen of Death at one point. One guy had even predicted that Microsoft will introduce a Red Screen of Death…….in 2016. Check out this article I wrote on May 12, 2005: Microsoft Upgrades Blue Screen of Death. I think you will enjoy it.
WARNING! Low disk space on a server can be disastrous and can crash your server. Just because the Health Analyzer warning about the low disk space can often be deceiving, you shouldn’t always ignore this warning. That’s exactly why I don’t recommend deleting the warning message. Make sure that you keep an eye on the available disk space on all your servers and take appropriate actions right away.
Default Memory Dump Settings
Here’s how I deal with the memory dump setting in Windows clients and servers. This may or may not work for everyone but I turn off the memory dump on my servers. These are the memory dump settings that I use on all my client and workstations on my network. I also have been recommended these same settings for my clients for at least 10+ years. First let’s look at the default memory dump settings. This screenshot is from a Windows Server 2016 Datacenter, which by the way is hosting a SharePoint Server 2016 Enterprise. Notice the default time to display the list of operating systems is set to 30 seconds and memory dump is set for Automatic memory dump.
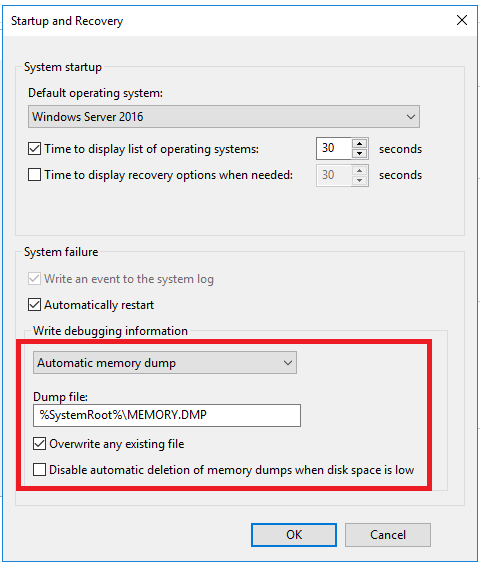
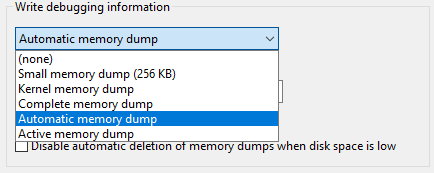
The following options are available for you to configure the memory dump. The Small memory dump will create a limited dump of 256KB of memory content. The Kernel memory dump is limited to the dump of the operating system kernel memory and a Complete memory dump will do a full memory dump of everything in the system memory. The Automatic memory dump is the default setting. Setting the option to none will turn off the memory dump.
My Memory Dump Settings
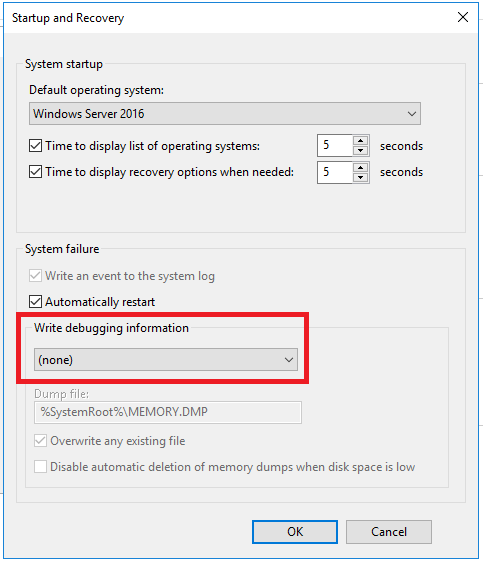
Here are the settings that I use on my servers. I set the memory dump to none, so there’s no disk space wasted in case of a system crash by dumping a large file on my system partition.
I also set the Time to display list of operating systems and the Time to display recovery options when needed to 5 seconds. The first option is only used when you are running multiple operating systems on a computer. Any wise person is not going to run multiple operating systems on a server that’s running in a production environment. This setting is really meant for workstations or test environments where you want enough time to select from a list of operating systems on the screen.
For the recovery options, 5 seconds is plenty of time for you to select an option. If you need more time to read the options on the screen, all you have to do is move your cursor up or down on the list of choices to get as much time as you want to make a selection.
The Reason Behind Disabling Memory Dump
The main reason I disable the memory dump is that I don’t plan to use it and if my system crashes I am not wasting disk space. If I ever plan to use the memory.dmp file for debugging, I will turn on the debugging and let windows save the debugging information. If my system is crashing and won’t even reboot then of course I won’t be able to change the setting and create a dump file. That’s the chance that I am willing to take. So far I haven’t run into a situation that I really needed the debug file so bad that I regretted my decision. And here’s my philosophy on why I feel I don’t need the memory.dmp file. If my SharePoint server crashes, I can rebuild it from scratch probably two or three times, if not more, in the time it will take me to debug the memory dump….and that’s if I am lucky. If I have to send the debug file to a vendor, it may take several days before I will get an answer…..and if they don’t have a solution it may not solve my problem at all. Because SharePoint data is kept in SQL Server, rebuilding a SharePoint is not too difficult as long as you have your SQL Server databases. That’s why you want to make sure that your SQL Server are clustered, protected with uninterruptible power supplies, and the SQL databases are regularly backed up. The same argument applies to Domain Controllers (DCs). I always have two or more DCs on my network and I make daily backups of my Active Directory (AD) database. The AD and AD-integrated DNS databases are replicated to other servers. Replacing a crashed DC is relatively easy. So now you know why I feel this debug file (memory.dmp) is not meant for everyone and is something that is used in extremely rare situations.
Copyright © 2016 SeattlePro Enterprises, LLC. All rights reserved.